Basic knowledge of APS production scheduling software-Planning Gantt chart
Overview: The Production Plan Gantt chart is the most common way to display production plans. The advantage of using graphical display of production plans is that it is intuitive and efficient, and it is clear at a glance whether the plan is reasonable and whether there are conflicts. This article introduces the basic principles and applications of planning Gantt charts.
The Gantt chart mentioned in this article refers to the main resource Gantt chart, and the Gantt chart example is taken from the PlanMate APS intelligent production scheduling system.
Gantt chart basics:
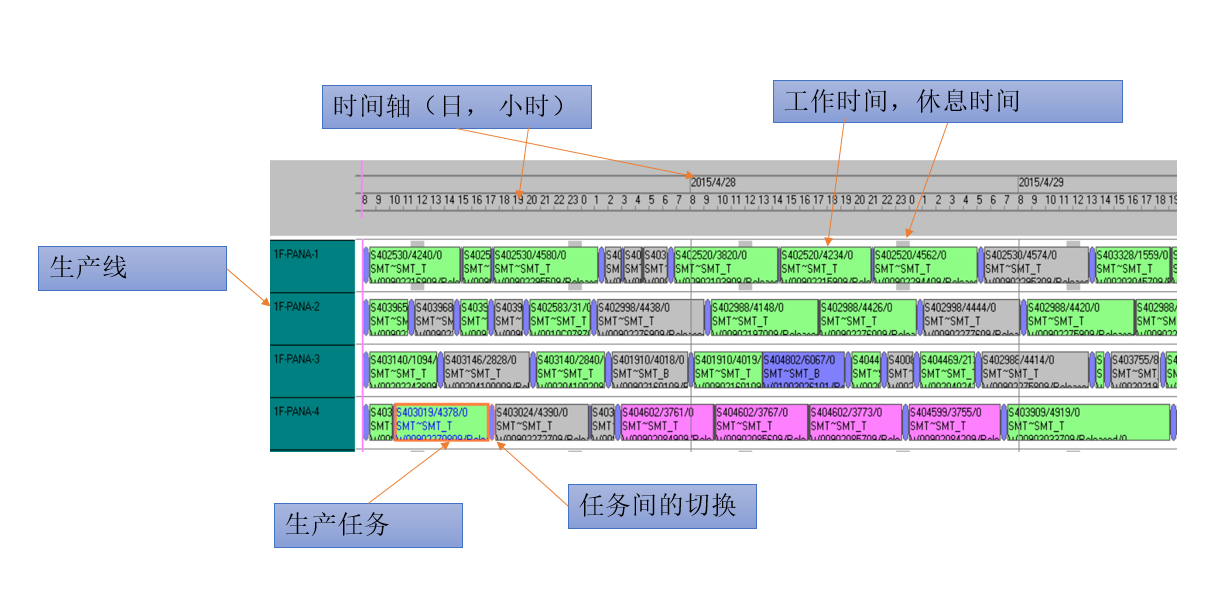
The above is part of the resource Gantt chart. We explain several basic concepts:
1: The horizontal axis is time in weeks, days, and hours. The scheduling time is accurate to the second.
2: The vertical direction displays the production line (main resource)
3: In the middle area, each rectangle is a production task, and the information of the task is displayed within the rectangle.
4: The blue oval between the two rectangles is the switching time
The following basic facts can be seen from the graph:
- Tasks on the main resource cannot overlap and can only be arranged one after another.
- Tasks will be stretched during breaks
Basic operations of Gantt chart:
- Tasks can be moved to a new location (if defined in the model)
- Tasks can be moved back and forth (subsequent tasks will follow)
- Can be zoomed in or out
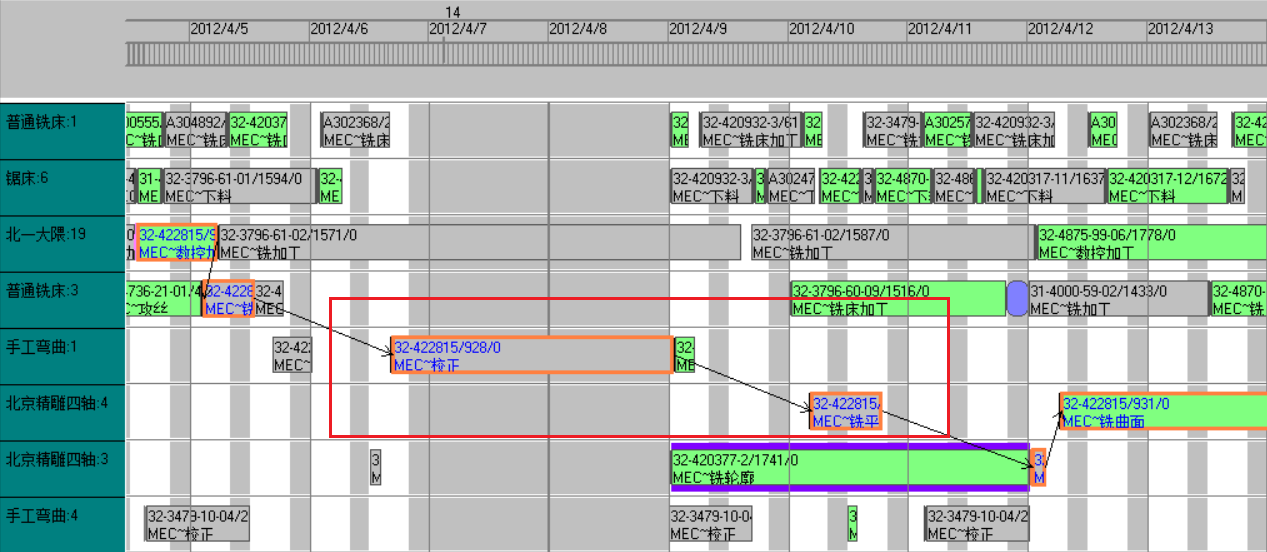
Process relationship:
The figure above shows the production tasks generated by a product work order and the timing relationship between tasks. The rationality of the plan can be seen from the picture:
- The process sequence meets the model definition and there is no conflict
- The time between processes is compact and there is no waste
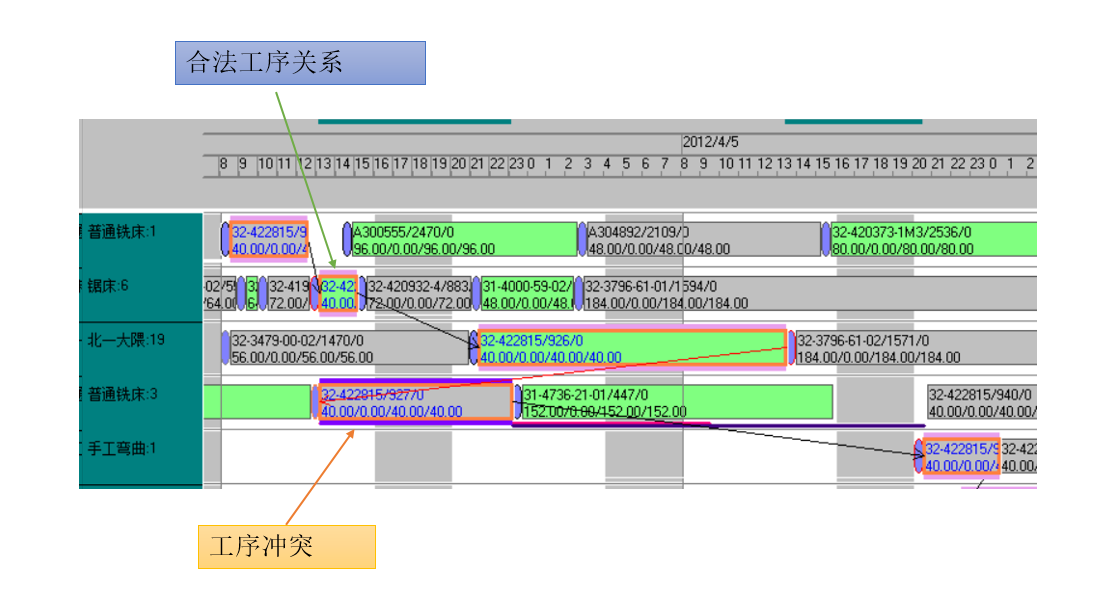
We move the task, create a conflict, and immediately see the location of the conflict in the Gantt chart. This is also the benefit of the Gantt chart. There is no need to analyze the data, you can just judge by the shape.
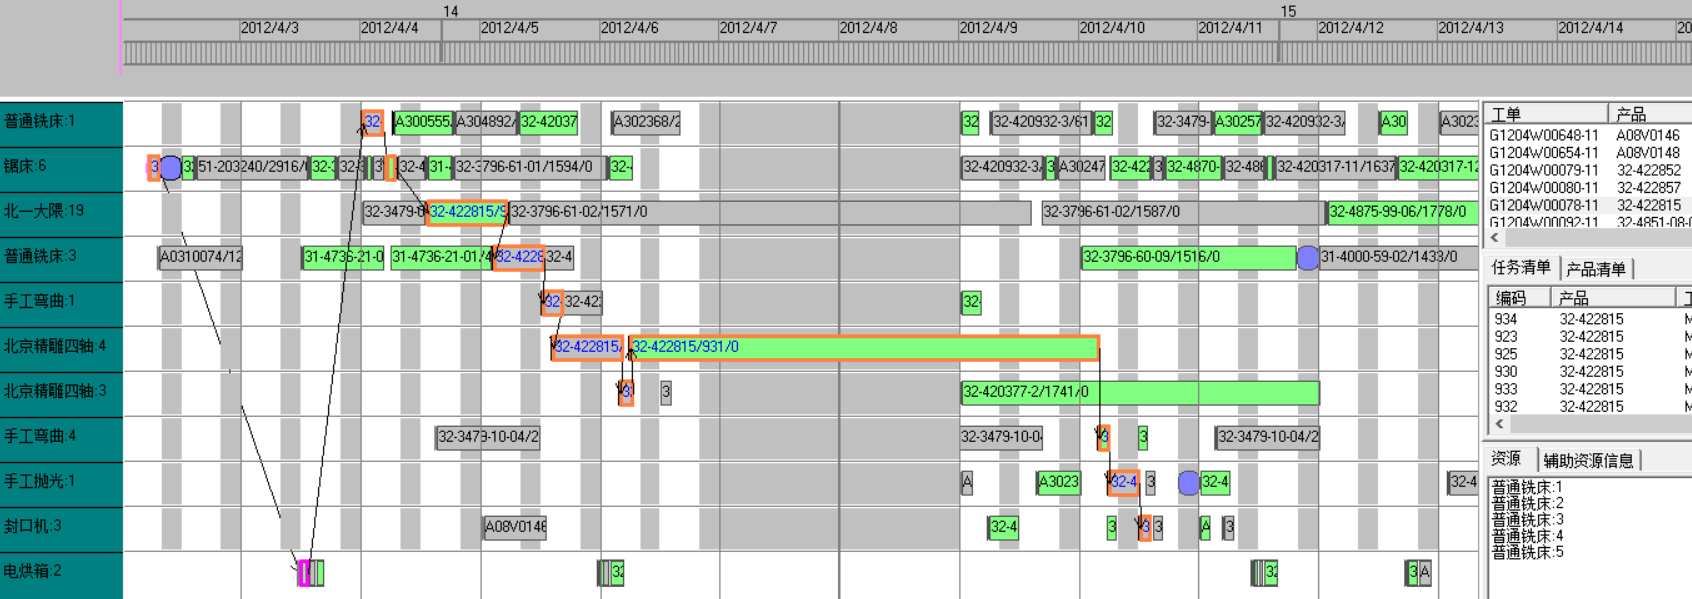
Let’s look at the next example:
In the picture above, there are no errors in the process, but the WIP is stretched between processes and the equipment is idle. This is an unreasonable plan, but the system does not alarm.
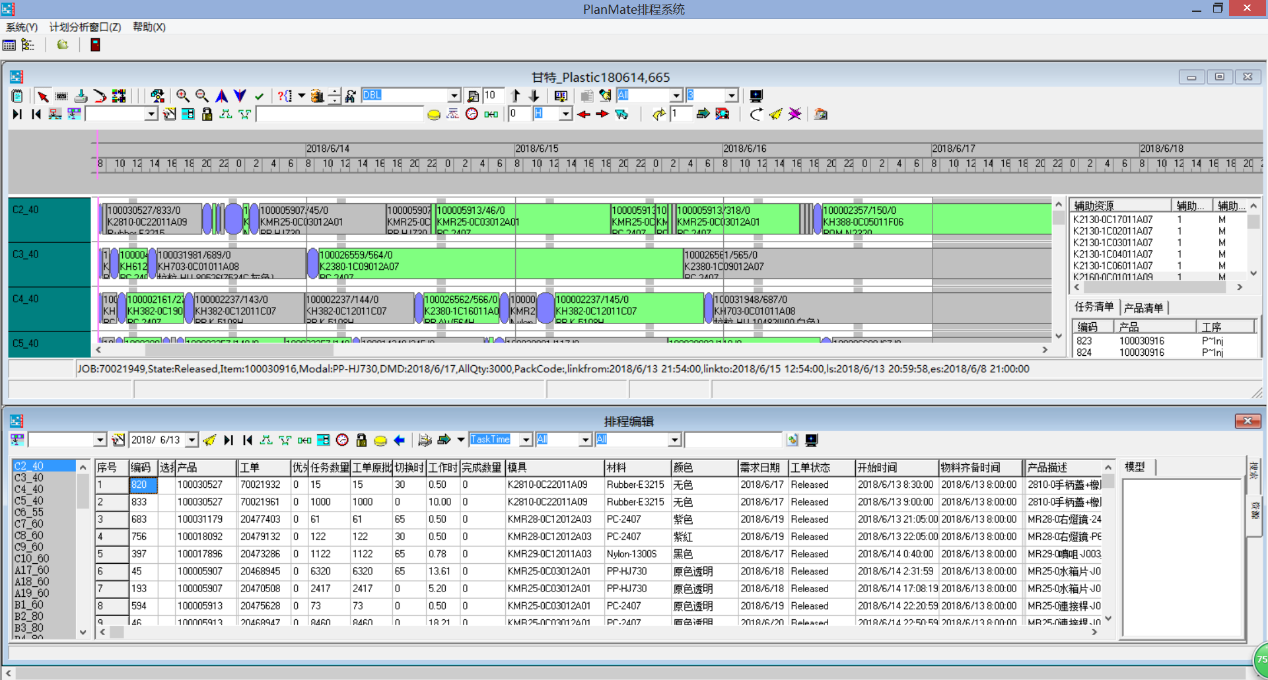
Auxiliary resources:
In the Gantt chart, we can also easily check the use and conflicts of auxiliary resources. The following is an example of scheduling in the injection molding industry:
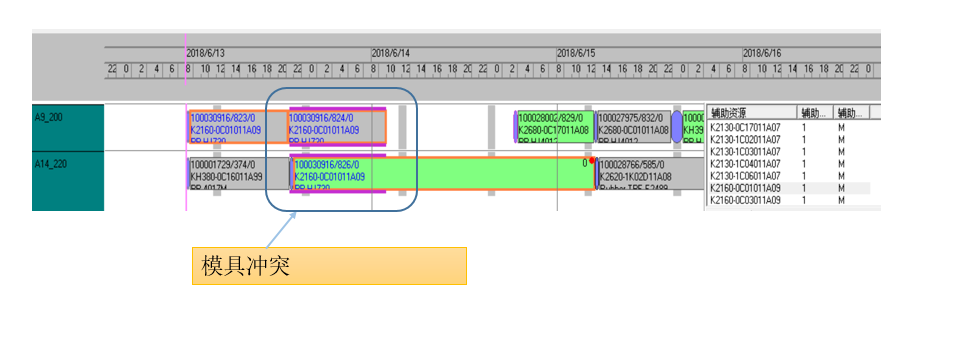
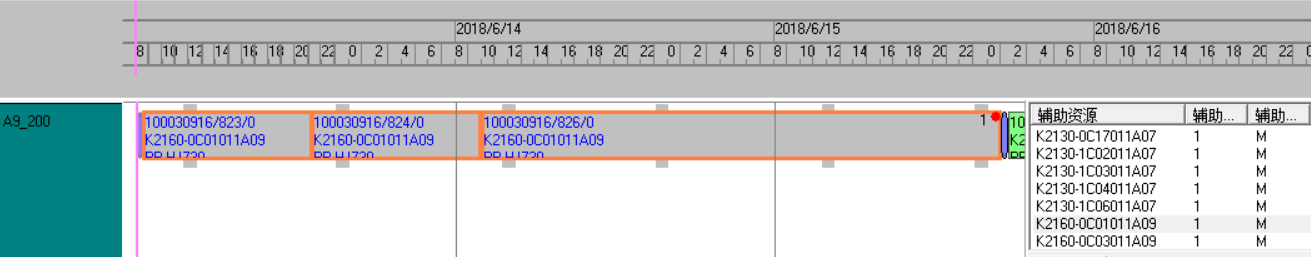
Highlighted in the image above are tasks using the same mold. A list of molds is listed on the right. Select a mold to highlight the tasks using that mold.
Moving the job to another machine while producing, you can see mold conflicts
Figures and tables:
If the work order is small and the task requires a short time, you can use tables to display more detailed information and combine graphics with tables.